If you’re looking at how Google Ads performance has evolved, it’s important to understand where things started.
This page breaks down real Google Ads performance across industries using data from accounts we’ve worked with and analyzed, giving you a baseline view of costs, conversion rates, and performance trends in 2023.
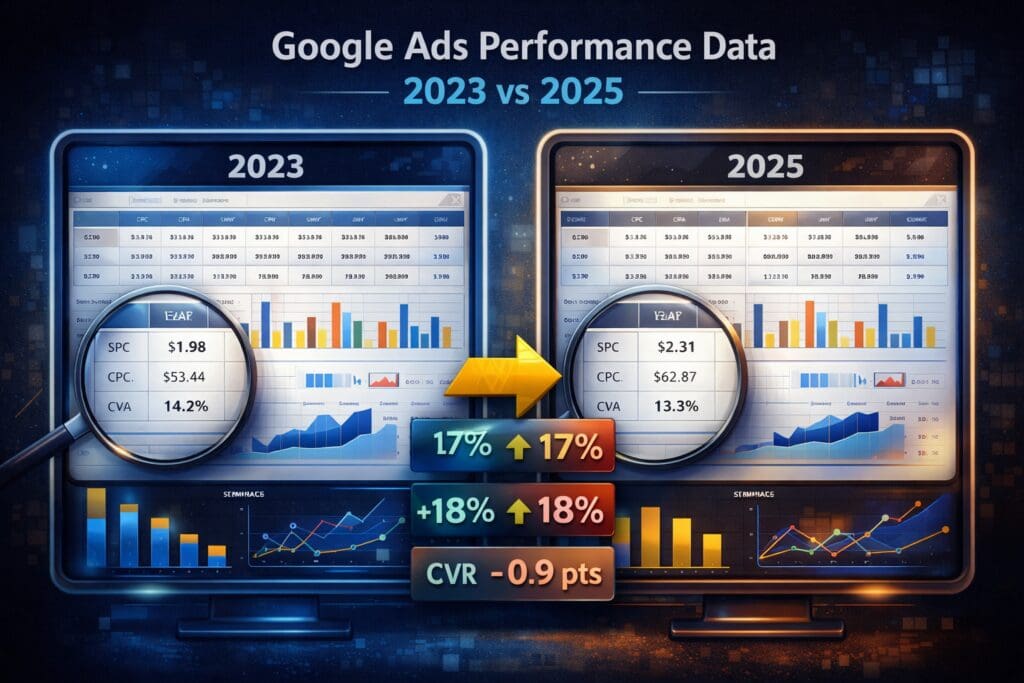
Here’s how performance has trended over time:
| Industry | Accounts | Spend | Impressions | Clicks | Conversions | CTR | CVR | CPC | CPA | Conv Value | Conv Value / Cost | Zero-Conv Accounts | |
|---|---|---|---|---|---|---|---|---|---|---|---|---|---|
| Painting & Surface Coatings | 24 | $528,490.50 | 4,338,256.00 | 162,456.00 | 6,756.62 | 3.74% | 4.16% | $3.25 | $78.22 | $0.00 | 0 | 1 | |
| Home Services | 12 | $439,676.30 | 9,102,734.00 | 84,492.00 | 12,619.42 | 0.93% | 14.94% | $5.20 | $34.84 | $0.00 | 0 | 3 | |
| Health & Wellness | 4 | $438,360.30 | 25,430,259.00 | 316,520.00 | 30,030.13 | 1.24% | 9.49% | $1.38 | $14.60 | $0.00 | 0 | 0 | |
| Windows / Doors / Garage | 14 | $408,688.90 | 671,680.00 | 34,244.00 | 4,404.02 | 5.10% | 12.86% | $11.93 | $92.80 | $0.00 | 0 | 0 | |
| Retail & Ecommerce | 8 | $285,483.10 | 26,155,659.00 | 290,437.00 | 24,552.98 | 1.11% | 8.45% | $0.98 | $11.63 | $0.00 | 0 | 0 | |
| Legal | 5 | $147,200.10 | 10,658,356.00 | 42,689.00 | 5,158.45 | 0.40% | 12.08% | $3.45 | $28.54 | $0.00 | 0 | 0 | |
| Technology / SaaS | 3 | $121,731.30 | 3,070,069.00 | 47,651.00 | 5,627.97 | 1.55% | 11.81% | $2.55 | $21.63 | $0.00 | 0 | 0 | |
| Manufacturing / Industrial | 3 | $90,087.06 | 11,201,886.00 | 101,489.00 | 866.00 | 0.91% | 0.85% | $0.89 | $104.03 | $0.00 | 0 | 0 | |
| Roofing | 3 | $53,102.27 | 133,162.00 | 3,635.00 | 401.00 | 2.73% | 11.03% | $14.61 | $132.42 | $0.00 | 0 | 0 | |
| Automotive / Transport | 2 | $53,045.75 | 6,588,949.00 | 52,167.00 | 617.73 | 0.79% | 1.18% | $1.02 | $85.87 | $0.00 | 0 | 0 | |
| Healthcare | 6 | $47,440.50 | 394,573.00 | 17,155.00 | 1,798.51 | 4.35% | 10.48% | $2.77 | $26.38 | $0.00 | 0 | 1 | |
| Education & Training | 3 | $46,933.80 | 645,705.00 | 20,640.00 | 1,310.80 | 3.20% | 6.35% | $2.27 | $35.81 | $0.00 | 0 | 0 | |
| Professional Services | 4 | $44,239.55 | 7,552,010.00 | 38,080.00 | 8,398.63 | 0.50% | 22.06% | $1.16 | $5.27 | $0.00 | 0 | 0 | |
| Entertainment & Events | 3 | $26,052.33 | 2,802,804.00 | 34,100.00 | 4,522.37 | 1.22% | 13.26% | $0.76 | $5.76 | $0.00 | 0 | 0 | |
| Veterinary / Pet | 1 | $14,537.67 | 178,661.00 | 14,669.00 | 3,282.00 | 8.21% | 22.37% | $0.99 | $4.43 | $0.00 | 0 | 0 | |
| Vision / Eye Care | 1 | $11,182.51 | 533,264.00 | 6,172.00 | 1,036.00 | 1.16% | 16.79% | $1.81 | $10.79 | $0.00 | 0 | 0 | |
| Insurance / Financial | 2 | $10,409.30 | 4,074,082.00 | 8,722.00 | 1,308.92 | 0.21% | 15.01% | $1.19 | $7.95 | $0.00 | 0 | 0 | |
| Government / Nonprofit | 3 | $7,124.23 | 12,906.00 | 1,253.00 | 229.28 | 9.71% | 18.30% | $5.69 | $31.07 | $0.00 | 0 | 2 | |
| Restaurant / Hospitality | 1 | $4,122.07 | 607,490.00 | 14,037.00 | 3,082.00 | 2.31% | 21.96% | $0.29 | $1.34 | $0.00 | 0 | 0 |
| Industry | Network | Spend | Clicks | Impressions | Conversions | Conv Value | CTR | CVR | CPC | CPA |
|---|---|---|---|---|---|---|---|---|---|---|
| Automotive / Transport | Cross-network | $67,708.84 | 89,018.00 | 19,502,387.00 | 9,916.18 | $114,820.20 | 0.004564 | 0.111395 | $0.76 | $6.83 |
| Automotive / Transport | Discover | $0.00 | 0.00 | 0.00 | 0.00 | $0.00 | ||||
| Automotive / Transport | Gmail | $0.00 | 0.00 | 0.00 | 0.00 | $0.00 | ||||
| Automotive / Transport | Google Display Network | $0.00 | 0.00 | 0.00 | 0.00 | $0.00 | ||||
| Automotive / Transport | Google Search | $40,697.22 | 10,614.00 | 538,602.00 | 702.00 | $4,839.96 | 0.019707 | 0.066139 | $3.83 | $57.97 |
| Automotive / Transport | Google TV | $0.00 | 0.00 | 0.00 | 0.00 | $0.00 | ||||
| Automotive / Transport | Google owned channels | $0.00 | 0.00 | 0.00 | 0.00 | $0.00 | ||||
| Automotive / Transport | Maps | $0.00 | 0.00 | 0.00 | 0.00 | $0.00 | ||||
| Automotive / Transport | Search partners | $1,836.39 | 1,169.00 | 200,274.00 | 25.00 | $179.95 | 0.005837 | 0.021386 | $1.57 | $73.46 |
| Automotive / Transport | YouTube | $0.00 | 0.00 | 0.00 | 0.00 | $0.00 | ||||
| Education & Training | Cross-network | $949.40 | 1,275.00 | 402,136.00 | 211.00 | $187.00 | 0.003171 | 0.16549 | $0.74 | $4.50 |
| Education & Training | Discover | $0.00 | 0.00 | 0.00 | 0.00 | $0.00 | ||||
| Education & Training | Gmail | $0.00 | 0.00 | 0.00 | 0.00 | $0.00 | ||||
| Education & Training | Google Display Network | $0.18 | 0.00 | 3.00 | 0.00 | $0.00 | 0 | inf | inf | |
| Education & Training | Google Search | $45,846.93 | 19,281.00 | 227,579.00 | 1,093.80 | $503.00 | 0.084722 | 0.056729 | $2.38 | $41.92 |
| Education & Training | Google TV | $0.00 | 0.00 | 0.00 | 0.00 | $0.00 | ||||
| Education & Training | Google owned channels | $0.00 | 0.00 | 0.00 | 0.00 | $0.00 | ||||
| Education & Training | Maps | $0.00 | 0.00 | 0.00 | 0.00 | $0.00 | ||||
| Education & Training | Search partners | $8.83 | 6.00 | 599.00 | 0.00 | $0.00 | 0.010017 | 0 | $1.47 | inf |
| Education & Training | YouTube | $128.47 | 78.00 | 15,388.00 | 6.00 | $96.00 | 0.005069 | 0.076923 | $1.65 | $21.41 |
| Entertainment & Events | Cross-network | $5,790.59 | 15,697.00 | 1,245,425.00 | 1,434.10 | $7,123.73 | 0.012604 | 0.091361 | $0.37 | $4.04 |
| Entertainment & Events | Discover | $0.00 | 0.00 | 0.00 | 0.00 | $0.00 | ||||
| Entertainment & Events | Gmail | $0.00 | 0.00 | 0.00 | 0.00 | $0.00 | ||||
| Entertainment & Events | Google Display Network | $2,125.94 | 4,414.00 | 1,435,976.00 | 235.48 | $0.00 | 0.003074 | 0.053348 | $0.48 | $9.03 |
| Entertainment & Events | Google Search | $17,985.64 | 13,655.00 | 109,846.00 | 2,834.79 | $58,308.08 | 0.12431 | 0.207601 | $1.32 | $6.34 |
| Entertainment & Events | Google TV | $0.00 | 0.00 | 0.00 | 0.00 | $0.00 | ||||
| Entertainment & Events | Google owned channels | $0.00 | 0.00 | 0.00 | 0.00 | $0.00 | ||||
| Entertainment & Events | Maps | $0.00 | 0.00 | 0.00 | 0.00 | $0.00 | ||||
| Entertainment & Events | Search partners | $150.16 | 334.00 | 11,557.00 | 18.00 | $258.72 | 0.0289 | 0.053892 | $0.45 | $8.34 |
| Entertainment & Events | YouTube | $0.00 | 0.00 | 0.00 | 0.00 | $0.00 | ||||
| Government / Nonprofit | Cross-network | $0.00 | 0.00 | 0.00 | 0.00 | $0.00 | ||||
| Government / Nonprofit | Discover | $0.00 | 0.00 | 0.00 | 0.00 | $0.00 | ||||
| Government / Nonprofit | Gmail | $0.00 | 0.00 | 0.00 | 0.00 | $0.00 | ||||
| Government / Nonprofit | Google Display Network | $0.00 | 0.00 | 0.00 | 0.00 | $0.00 | ||||
| Government / Nonprofit | Google Search | $7,124.23 | 1,253.00 | 12,906.00 | 229.28 | $452.51 | 0.097087 | 0.182985 | $5.69 | $31.07 |
| Government / Nonprofit | Google TV | $0.00 | 0.00 | 0.00 | 0.00 | $0.00 | ||||
| Government / Nonprofit | Google owned channels | $0.00 | 0.00 | 0.00 | 0.00 | $0.00 | ||||
| Government / Nonprofit | Maps | $0.00 | 0.00 | 0.00 | 0.00 | $0.00 | ||||
| Government / Nonprofit | Search partners | $0.00 | 0.00 | 0.00 | 0.00 | $0.00 | ||||
| Government / Nonprofit | YouTube | $0.00 | 0.00 | 0.00 | 0.00 | $0.00 | ||||
| Health & Wellness | Cross-network | $263,016.40 | 215,764.00 | 23,250,076.00 | 11,334.56 | $825,215.20 | 0.00928 | 0.052532 | $1.22 | $23.20 |
| Health & Wellness | Discover | $0.00 | 0.00 | 0.00 | 0.00 | $0.00 | ||||
| Health & Wellness | Gmail | $0.00 | 0.00 | 0.00 | 0.00 | $0.00 | ||||
| Health & Wellness | Google Display Network | $43.14 | 180.00 | 9,888.00 | 0.00 | $0.00 | 0.018204 | 0 | $0.24 | inf |
| Health & Wellness | Google Search | $172,581.10 | 97,272.00 | 1,982,800.00 | 18,280.57 | $505,033.70 | 0.049058 | 0.187932 | $1.77 | $9.44 |
| Health & Wellness | Google TV | $0.00 | 0.00 | 0.00 | 0.00 | $0.00 | ||||
| Health & Wellness | Google owned channels | $0.00 | 0.00 | 0.00 | 0.00 | $0.00 | ||||
| Health & Wellness | Maps | $0.00 | 0.00 | 0.00 | 0.00 | $0.00 | ||||
| Health & Wellness | Search partners | $885.06 | 2,522.00 | 158,120.00 | 393.00 | $383.04 | 0.01595 | 0.155829 | $0.35 | $2.25 |
| Health & Wellness | YouTube | $0.00 | 0.00 | 0.00 | 0.00 | $0.00 | ||||
| Healthcare | Cross-network | $6,082.76 | 2,802.00 | 213,547.00 | 111.51 | $83.51 | 0.013121 | 0.039797 | $2.17 | $54.55 |
| Healthcare | Discover | $0.00 | 0.00 | 0.00 | 0.00 | $0.00 | ||||
| Healthcare | Gmail | $0.00 | 0.00 | 0.00 | 0.00 | $0.00 | ||||
| Healthcare | Google Display Network | $0.00 | 0.00 | 0.00 | 0.00 | $0.00 | ||||
| Healthcare | Google Search | $27,353.86 | 8,297.00 | 108,220.00 | 257.00 | $156.00 | 0.076668 | 0.030975 | $3.30 | $106.44 |
| Healthcare | Google TV | $0.00 | 0.00 | 0.00 | 0.00 | $0.00 | ||||
| Healthcare | Google owned channels | $0.00 | 0.00 | 0.00 | 0.00 | $0.00 | ||||
| Healthcare | Maps | $0.00 | 0.00 | 0.00 | 0.00 | $0.00 | ||||
| Healthcare | Search partners | $671.09 | 840.00 | 5,733.00 | 3.00 | $2.00 | 0.14652 | 0.003571 | $0.80 | $223.70 |
| Healthcare | YouTube | $0.00 | 0.00 | 0.00 | 0.00 | $0.00 | ||||
| Home Services | Cross-network | $14,559.24 | 28,770.00 | 5,633,007.00 | 8,345.57 | $13,419.67 | 0.005107 | 0.290079 | $0.51 | $1.74 |
| Home Services | Discover | $0.00 | 0.00 | 0.00 | 0.00 | $0.00 | ||||
| Home Services | Gmail | $0.00 | 0.00 | 0.00 | 0.00 | $0.00 | ||||
| Home Services | Google Display Network | $488.43 | 1,111.00 | 116,021.00 | 5.00 | $5.00 | 0.009576 | 0.0045 | $0.44 | $97.69 |
| Home Services | Google Search | $388,097.90 | 33,223.00 | 409,656.00 | 3,126.39 | $22,117.29 | 0.0811 | 0.094103 | $11.68 | $124.14 |
| Home Services | Google TV | $0.00 | 0.00 | 0.00 | 0.00 | $0.00 | ||||
| Home Services | Google owned channels | $0.00 | 0.00 | 0.00 | 0.00 | $0.00 | ||||
| Home Services | Maps | $0.00 | 0.00 | 0.00 | 0.00 | $0.00 | ||||
| Home Services | Search partners | $18,297.00 | 6,432.00 | 82,699.00 | 133.00 | $3,458.00 | 0.077776 | 0.020678 | $2.84 | $137.57 |
| Home Services | YouTube | $0.11 | 2.00 | 19.00 | 0.00 | $0.00 | 0.105263 | 0 | $0.06 | inf |
| Insurance / Financial | Cross-network | $3,733.87 | 4,786.00 | 3,827,331.00 | 887.00 | $887.00 | 0.00125 | 0.185332 | $0.78 | $4.21 |
| Insurance / Financial | Discover | $0.00 | 0.00 | 0.00 | 0.00 | $0.00 | ||||
| Insurance / Financial | Gmail | $0.00 | 0.00 | 0.00 | 0.00 | $0.00 | ||||
| Insurance / Financial | Google Display Network | $756.03 | 1,516.00 | 220,877.00 | 8.98 | $0.00 | 0.006864 | 0.005923 | $0.50 | $84.19 |
| Insurance / Financial | Google Search | $5,744.36 | 2,341.00 | 24,254.00 | 406.94 | $285.00 | 0.09652 | 0.173832 | $2.45 | $14.12 |
| Insurance / Financial | Google TV | $0.00 | 0.00 | 0.00 | 0.00 | $0.00 | ||||
| Insurance / Financial | Google owned channels | $0.00 | 0.00 | 0.00 | 0.00 | $0.00 | ||||
| Insurance / Financial | Maps | $0.00 | 0.00 | 0.00 | 0.00 | $0.00 | ||||
| Insurance / Financial | Search partners | $175.04 | 79.00 | 1,620.00 | 6.00 | $1.00 | 0.048765 | 0.075949 | $2.22 | $29.17 |
| Insurance / Financial | YouTube | $0.00 | 0.00 | 0.00 | 0.00 | $0.00 | ||||
| Legal | Cross-network | $9,526.29 | 17,634.00 | 8,934,858.00 | 2,564.75 | $2,988.25 | 0.001974 | 0.145443 | $0.54 | $3.71 |
| Legal | Discover | $0.00 | 0.00 | 0.00 | 0.00 | $0.00 | ||||
| Legal | Gmail | $0.00 | 0.00 | 0.00 | 0.00 | $0.00 | ||||
| Legal | Google Display Network | $3,926.26 | 5,039.00 | 1,532,169.00 | 16.00 | $16.25 | 0.003289 | 0.003175 | $0.78 | $245.39 |
| Legal | Google Search | $126,570.40 | 18,210.00 | 170,112.00 | 2,532.70 | $2,569.70 | 0.107047 | 0.139083 | $6.95 | $49.97 |
| Legal | Google TV | $0.00 | 0.00 | 0.00 | 0.00 | $0.00 | ||||
| Legal | Google owned channels | $0.00 | 0.00 | 0.00 | 0.00 | $0.00 | ||||
| Legal | Maps | $0.00 | 0.00 | 0.00 | 0.00 | $0.00 | ||||
| Legal | Search partners | $7,177.15 | 1,806.00 | 21,217.00 | 45.00 | $48.50 | 0.08512 | 0.024917 | $3.97 | $159.49 |
| Legal | YouTube | $0.00 | 0.00 | 0.00 | 0.00 | $0.00 | ||||
| Manufacturing / Industrial | Cross-network | $47,024.68 | 83,390.00 | 8,485,230.00 | 605.23 | $299,924.40 | 0.009828 | 0.007258 | $0.56 | $77.70 |
| Manufacturing / Industrial | Discover | $0.00 | 0.00 | 0.00 | 0.00 | $0.00 | ||||
| Manufacturing / Industrial | Gmail | $0.00 | 0.00 | 0.00 | 0.00 | $0.00 | ||||
| Manufacturing / Industrial | Google Display Network | $3,084.51 | 2,500.00 | 2,221,953.00 | 2.00 | $1,630.31 | 0.001125 | 0.0008 | $1.23 | $1,542.26 |
| Manufacturing / Industrial | Google Search | $38,458.96 | 14,027.00 | 172,542.00 | 243.77 | $156,263.60 | 0.081296 | 0.017379 | $2.74 | $157.77 |
| Manufacturing / Industrial | Google TV | $0.00 | 0.00 | 0.00 | 0.00 | $0.00 | ||||
| Manufacturing / Industrial | Google owned channels | $0.00 | 0.00 | 0.00 | 0.00 | $0.00 | ||||
| Manufacturing / Industrial | Maps | $0.00 | 0.00 | 0.00 | 0.00 | $0.00 | ||||
| Manufacturing / Industrial | Search partners | $1,518.91 | 1,572.00 | 322,161.00 | 15.00 | $3,709.41 | 0.00488 | 0.009542 | $0.97 | $101.26 |
| Manufacturing / Industrial | YouTube | $0.00 | 0.00 | 0.00 | 0.00 | $0.00 | ||||
| Painting & Surface Coatings | Cross-network | $104,534.50 | 27,274.00 | 859,881.00 | 1,519.58 | $5,762.08 | 0.031718 | 0.055715 | $3.83 | $68.79 |
| Painting & Surface Coatings | Discover | $0.00 | 0.00 | 0.00 | 0.00 | $0.00 | ||||
| Painting & Surface Coatings | Gmail | $0.00 | 0.00 | 0.00 | 0.00 | $0.00 | ||||
| Painting & Surface Coatings | Google Display Network | $7,593.41 | 22,081.00 | 1,880,183.00 | 12.00 | $9.00 | 0.011744 | 0.000543 | $0.34 | $632.78 |
| Painting & Surface Coatings | Google Search | $349,327.10 | 69,702.00 | 997,068.00 | 3,054.04 | $43,125.84 | 0.069907 | 0.043816 | $5.01 | $114.38 |
| Painting & Surface Coatings | Google TV | $0.00 | 0.00 | 0.00 | 0.00 | $0.00 | ||||
| Painting & Surface Coatings | Google owned channels | $0.00 | 0.00 | 0.00 | 0.00 | $0.00 | ||||
| Painting & Surface Coatings | Maps | $0.00 | 0.00 | 0.00 | 0.00 | $0.00 | ||||
| Painting & Surface Coatings | Search partners | $100,483.40 | 47,619.00 | 547,302.00 | 2,477.00 | $3,501.00 | 0.087007 | 0.052017 | $2.11 | $40.57 |
| Painting & Surface Coatings | YouTube | $931.03 | 177.00 | 174,023.00 | 82.00 | $82.00 | 0.001017 | 0.463277 | $5.26 | $11.35 |
| Professional Services | Cross-network | $9,369.05 | 15,623.00 | 7,106,696.00 | 3,311.01 | $3,311.58 | 0.002198 | 0.211932 | $0.60 | $2.83 |
| Professional Services | Discover | $0.00 | 0.00 | 0.00 | 0.00 | $0.00 | ||||
| Professional Services | Gmail | $0.00 | 0.00 | 0.00 | 0.00 | $0.00 | ||||
| Professional Services | Google Display Network | $875.69 | 1,592.00 | 232,927.00 | 9.98 | $1.25 | 0.006835 | 0.006269 | $0.55 | $87.74 |
| Professional Services | Google Search | $32,277.82 | 19,581.00 | 174,696.00 | 5,021.64 | $4,083.58 | 0.112086 | 0.256455 | $1.65 | $6.43 |
| Professional Services | Google TV | $0.00 | 0.00 | 0.00 | 0.00 | $0.00 | ||||
| Professional Services | Google owned channels | $0.00 | 0.00 | 0.00 | 0.00 | $0.00 | ||||
| Professional Services | Maps | $0.00 | 0.00 | 0.00 | 0.00 | $0.00 | ||||
| Professional Services | Search partners | $1,716.99 | 1,284.00 | 37,691.00 | 56.00 | $36.73 | 0.034066 | 0.043614 | $1.34 | $30.66 |
| Professional Services | YouTube | $0.00 | 0.00 | 0.00 | 0.00 | $0.00 | ||||
| Restaurant / Hospitality | Cross-network | $4,122.07 | 14,037.00 | 607,490.00 | 3,082.00 | $3,082.00 | 0.023107 | 0.219563 | $0.29 | $1.34 |
| Restaurant / Hospitality | Discover | $0.00 | 0.00 | 0.00 | 0.00 | $0.00 | ||||
| Restaurant / Hospitality | Gmail | $0.00 | 0.00 | 0.00 | 0.00 | $0.00 | ||||
| Restaurant / Hospitality | Google Display Network | $0.00 | 0.00 | 0.00 | 0.00 | $0.00 | ||||
| Restaurant / Hospitality | Google Search | $0.00 | 0.00 | 0.00 | 0.00 | $0.00 | ||||
| Restaurant / Hospitality | Google TV | $0.00 | 0.00 | 0.00 | 0.00 | $0.00 | ||||
| Restaurant / Hospitality | Google owned channels | $0.00 | 0.00 | 0.00 | 0.00 | $0.00 | ||||
| Restaurant / Hospitality | Maps | $0.00 | 0.00 | 0.00 | 0.00 | $0.00 | ||||
| Restaurant / Hospitality | Search partners | $0.00 | 0.00 | 0.00 | 0.00 | $0.00 | ||||
| Restaurant / Hospitality | YouTube | $0.00 | 0.00 | 0.00 | 0.00 | $0.00 | ||||
| Retail & Ecommerce | Cross-network | $126,623.50 | 102,389.00 | 11,478,025.00 | 1,878.10 | $380,566.50 | 0.00892 | 0.018343 | $1.24 | $67.42 |
| Retail & Ecommerce | Discover | $0.00 | 0.00 | 0.00 | 0.00 | $0.00 | ||||
| Retail & Ecommerce | Gmail | $0.00 | 0.00 | 0.00 | 0.00 | $0.00 | ||||
| Retail & Ecommerce | Google Display Network | $13,009.16 | 47,357.00 | 4,846,916.00 | 19,367.78 | $19,386.06 | 0.009771 | 0.408974 | $0.27 | $0.67 |
| Retail & Ecommerce | Google Search | $142,519.70 | 135,414.00 | 9,055,871.00 | 3,299.10 | $236,695.20 | 0.014953 | 0.024363 | $1.05 | $43.20 |
| Retail & Ecommerce | Google TV | $0.00 | 0.00 | 0.00 | 0.00 | $0.00 | ||||
| Retail & Ecommerce | Google owned channels | $0.00 | 0.00 | 0.00 | 0.00 | $0.00 | ||||
| Retail & Ecommerce | Maps | $0.00 | 0.00 | 0.00 | 0.00 | $0.00 | ||||
| Retail & Ecommerce | Search partners | $1,179.28 | 3,699.00 | 271,233.00 | 8.00 | $164.89 | 0.013638 | 0.002163 | $0.32 | $147.41 |
| Retail & Ecommerce | YouTube | $2,151.49 | 1,578.00 | 503,614.00 | 0.00 | $0.00 | 0.003133 | 0 | $1.36 | inf |
| Roofing | Cross-network | $1,092.79 | 969.00 | 71,646.00 | 30.00 | $87.00 | 0.013525 | 0.03096 | $1.13 | $36.43 |
| Roofing | Discover | $0.00 | 0.00 | 0.00 | 0.00 | $0.00 | ||||
| Roofing | Gmail | $0.00 | 0.00 | 0.00 | 0.00 | $0.00 | ||||
| Roofing | Google Display Network | $22.18 | 19.00 | 2,425.00 | 14.00 | $56.00 | 0.007835 | 0.736842 | $1.17 | $1.58 |
| Roofing | Google Search | $52,047.07 | 3,249.00 | 68,505.00 | 362.00 | $624.00 | 0.047427 | 0.111419 | $16.02 | $143.78 |
| Roofing | Google TV | $0.00 | 0.00 | 0.00 | 0.00 | $0.00 | ||||
| Roofing | Google owned channels | $0.00 | 0.00 | 0.00 | 0.00 | $0.00 | ||||
| Roofing | Maps | $0.00 | 0.00 | 0.00 | 0.00 | $0.00 | ||||
| Roofing | Search partners | $4,162.93 | 341.00 | 5,838.00 | 59.00 | $212.00 | 0.05841 | 0.173021 | $12.21 | $70.56 |
| Roofing | YouTube | $0.00 | 0.00 | 0.00 | 0.00 | $0.00 | ||||
| Technology / SaaS | Cross-network | $3,602.74 | 10,326.00 | 485,631.00 | 3,312.00 | $587.00 | 0.021263 | 0.320744 | $0.35 | $1.09 |
| Technology / SaaS | Discover | $0.00 | 0.00 | 0.00 | 0.00 | $0.00 | ||||
| Technology / SaaS | Gmail | $0.00 | 0.00 | 0.00 | 0.00 | $0.00 | ||||
| Technology / SaaS | Google Display Network | $4,906.79 | 15,026.00 | 2,287,354.00 | 72.00 | $307.00 | 0.006569 | 0.004792 | $0.33 | $68.15 |
| Technology / SaaS | Google Search | $96,354.09 | 17,448.00 | 222,545.00 | 1,766.97 | $15,299.85 | 0.078402 | 0.101271 | $5.52 | $54.53 |
| Technology / SaaS | Google TV | $0.00 | 0.00 | 0.00 | 0.00 | $0.00 | ||||
| Technology / SaaS | Google owned channels | $0.00 | 0.00 | 0.00 | 0.00 | $0.00 | ||||
| Technology / SaaS | Maps | $0.00 | 0.00 | 0.00 | 0.00 | $0.00 | ||||
| Technology / SaaS | Search partners | $16,867.64 | 4,851.00 | 74,539.00 | 477.00 | $246.00 | 0.06508 | 0.09833 | $3.48 | $35.36 |
| Technology / SaaS | YouTube | $0.00 | 0.00 | 0.00 | 0.00 | $0.00 | ||||
| Veterinary / Pet | Cross-network | $219.72 | 687.00 | 57,037.00 | 92.00 | $92.57 | 0.012045 | 0.133916 | $0.32 | $2.39 |
| Veterinary / Pet | Discover | $0.00 | 0.00 | 0.00 | 0.00 | $0.00 | ||||
| Veterinary / Pet | Gmail | $0.00 | 0.00 | 0.00 | 0.00 | $0.00 | ||||
| Veterinary / Pet | Google Display Network | $0.00 | 0.00 | 3.00 | 0.00 | $0.00 | 0 | |||
| Veterinary / Pet | Google Search | $13,999.51 | 13,447.00 | 100,988.00 | 3,165.00 | $3,192.88 | 0.133154 | 0.235368 | $1.04 | $4.42 |
| Veterinary / Pet | Google TV | $0.00 | 0.00 | 0.00 | 0.00 | $0.00 | ||||
| Veterinary / Pet | Google owned channels | $0.00 | 0.00 | 0.00 | 0.00 | $0.00 | ||||
| Veterinary / Pet | Maps | $0.00 | 0.00 | 0.00 | 0.00 | $0.00 | ||||
| Veterinary / Pet | Search partners | $318.44 | 535.00 | 20,633.00 | 25.00 | $25.23 | 0.025929 | 0.046729 | $0.60 | $12.74 |
| Veterinary / Pet | YouTube | $0.00 | 0.00 | 0.00 | 0.00 | $0.00 | ||||
| Vision / Eye Care | Cross-network | $0.00 | 0.00 | 0.00 | 0.00 | $0.00 | ||||
| Vision / Eye Care | Discover | $0.00 | 0.00 | 0.00 | 0.00 | $0.00 | ||||
| Vision / Eye Care | Gmail | $0.00 | 0.00 | 0.00 | 0.00 | $0.00 | ||||
| Vision / Eye Care | Google Display Network | $3,451.36 | 3,000.00 | 332,206.00 | 340.00 | $339.00 | 0.009031 | 0.113333 | $1.15 | $10.15 |
| Vision / Eye Care | Google Search | $6,843.77 | 2,423.00 | 197,904.00 | 695.00 | $666.00 | 0.012243 | 0.286835 | $2.82 | $9.85 |
| Vision / Eye Care | Google TV | $0.00 | 0.00 | 0.00 | 0.00 | $0.00 | ||||
| Vision / Eye Care | Google owned channels | $0.00 | 0.00 | 0.00 | 0.00 | $0.00 | ||||
| Vision / Eye Care | Maps | $0.00 | 0.00 | 0.00 | 0.00 | $0.00 | ||||
| Vision / Eye Care | Search partners | $887.37 | 749.00 | 3,154.00 | 1.00 | $1.00 | 0.237476 | 0.001335 | $1.18 | $887.37 |
| Vision / Eye Care | YouTube | $0.00 | 0.00 | 0.00 | 0.00 | $0.00 | ||||
| Windows / Doors / Garage | Cross-network | $8,336.94 | 8,065.00 | 407,304.00 | 519.28 | $519.28 | 0.019801 | 0.064387 | $1.03 | $16.05 |
| Windows / Doors / Garage | Discover | $0.00 | 0.00 | 0.00 | 0.00 | $0.00 | ||||
| Windows / Doors / Garage | Gmail | $0.00 | 0.00 | 0.00 | 0.00 | $0.00 | ||||
| Windows / Doors / Garage | Google Display Network | $78.36 | 24.00 | 3,672.00 | 0.00 | $0.00 | 0.006536 | 0 | $3.27 | inf |
| Windows / Doors / Garage | Google Search | $392,864.70 | 25,201.00 | 250,714.00 | 3,802.74 | $8,729.69 | 0.100517 | 0.150896 | $15.59 | $103.31 |
| Windows / Doors / Garage | Google TV | $0.00 | 0.00 | 0.00 | 0.00 | $0.00 | ||||
| Windows / Doors / Garage | Google owned channels | $0.00 | 0.00 | 0.00 | 0.00 | $0.00 | ||||
| Windows / Doors / Garage | Maps | $0.00 | 0.00 | 0.00 | 0.00 | $0.00 | ||||
| Windows / Doors / Garage | Search partners | $7,408.91 | 954.00 | 9,990.00 | 82.00 | $48.00 | 0.095495 | 0.085954 | $7.77 | $90.35 |
| Windows / Doors / Garage | YouTube | $0.00 | 0.00 | 0.00 | 0.00 | $0.00 |
The 2023 data reflects a strong reliance on Search campaigns, with limited use of other networks compared to more diversified strategies seen in later years.
Compared to later years:
This made 2023 a strong baseline for comparison.
In 2023, we saw:
Across most industries:
While costs were lower overall:
If you were running Google Ads in 2023:
You likely experienced:
This year serves as a:
These numbers give you a realistic performance range, not a guarantee.
Your results will vary based on:
If your current results are:
There’s usually a fixable reason.
We specialize in Google Ads for service-based businesses, including painting companies.
We’ll show you: