If you’re running Google Ads for a painting business, one of the biggest questions is:
“What should my cost per lead actually be?”
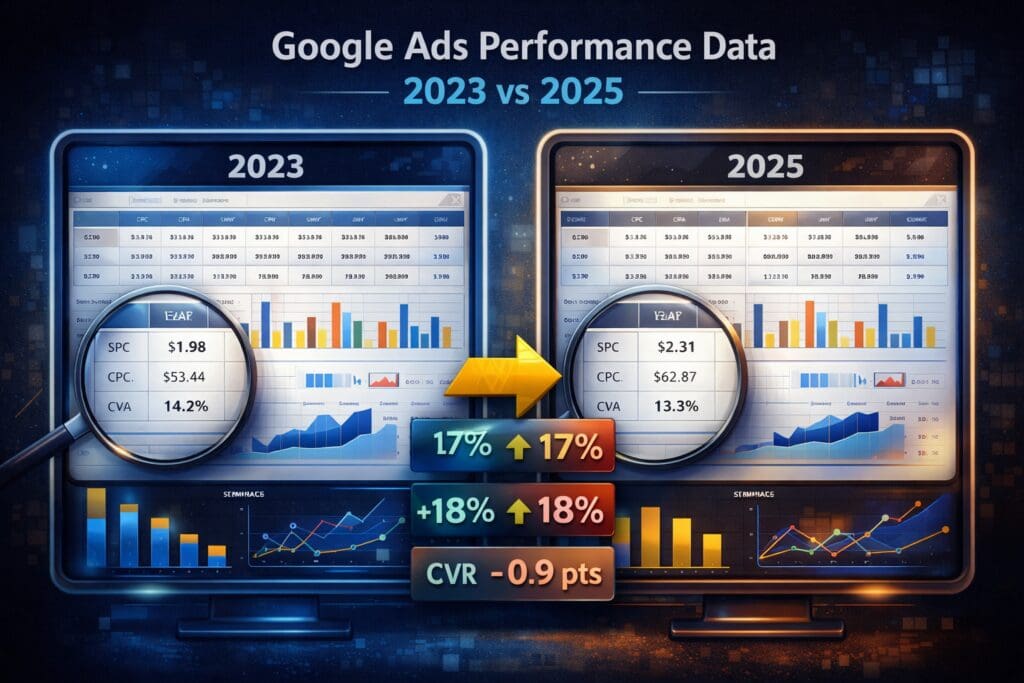
This page breaks down real performance data from painting and coating companies across 3 years, based on accounts we’ve worked with, managed, and analyzed.
Here’s how performance has trended over time:
| Year | Industry | Accounts | Spend | Impressions | Clicks | Conversions | CTR | CVR | CPC | CPA | Conv Value | Conv Value / Cost | Zero-Conv Accounts |
|---|---|---|---|---|---|---|---|---|---|---|---|---|---|
| 2023 | Painting & Surface Coatings | 24 | $528,490.50 | 4,338,256.00 | 162,456.00 | 6,756.62 | 3.74% | 4.16% | $3.25 | $78.22 | $0.00 | 0 | 1 |
| 2024 | Painting & Surface Coatings | 28 | $672,906.31 | 12,389,953 | 266,804 | 10254.8 | 2.20% | 3.80% | $2.52 | $65.62 | $167,391.48 | 24.88% | 1 |
| 2025 | Painting & Surface Coatings | 30 | $1,206,467.76 | 16,498,815 | 269,053 | 12,223.90 | 1.60% | 4.50% | $4.48 | $98.70 | $209,328.81 | 17% | 1 |
| Year | Industry | Network | Spend | Clicks | Impressions | Conversions | Conv Value | CTR | CVR | CPC | CPA |
|---|---|---|---|---|---|---|---|---|---|---|---|
| 2023 | Painting & Surface Coatings | Cross-network | $104,534.50 | 27,274.00 | 859,881.00 | 1,519.58 | $5,762.08 | 3.17% | 5.57% | $3.83 | $68.79 |
| 2023 | Painting & Surface Coatings | Discover | $0.00 | 0.00 | 0.00 | 0.00 | $0.00 | ||||
| 2023 | Painting & Surface Coatings | Gmail | $0.00 | 0.00 | 0.00 | 0.00 | $0.00 | ||||
| 2023 | Painting & Surface Coatings | Google Display Network | $7,593.41 | 22,081.00 | 1,880,183.00 | 12.00 | $9.00 | 1.17% | 0.05% | $0.34 | $632.78 |
| 2023 | Painting & Surface Coatings | Google Search | $349,327.10 | 69,702.00 | 997,068.00 | 3,054.04 | $43,125.84 | 6.99% | 4.38% | $5.01 | $114.38 |
| 2023 | Painting & Surface Coatings | Google TV | $0.00 | 0.00 | 0.00 | 0.00 | $0.00 | ||||
| 2023 | Painting & Surface Coatings | Google owned channels | $0.00 | 0.00 | 0.00 | 0.00 | $0.00 | ||||
| 2023 | Painting & Surface Coatings | Maps | $0.00 | 0.00 | 0.00 | 0.00 | $0.00 | ||||
| 2023 | Painting & Surface Coatings | Search partners | $100,483.40 | 47,619.00 | 547,302.00 | 2,477.00 | $3,501.00 | 8.70% | 5.20% | $2.11 | $40.57 |
| 2023 | Painting & Surface Coatings | YouTube | $931.03 | 177.00 | 174,023.00 | 82.00 | $82.00 | 0.10% | 46.33% | $5.26 | $11.35 |
| 2024 | Painting & Surface Coatings | Cross-network | $182,179.80 | 77,951.00 | 4,611,954.00 | 3,342.36 | $14,159.16 | 1.69% | 4.29% | $2.34 | $54.51 |
| 2024 | Painting & Surface Coatings | Discover | $0.00 | 0.00 | 0.00 | 0.00 | $0.00 | ||||
| 2024 | Painting & Surface Coatings | Gmail | $0.00 | 0.00 | 0.00 | 0.00 | $0.00 | ||||
| 2024 | Painting & Surface Coatings | Google Display Network | $29,134.93 | 85,869.00 | 9,017,565.00 | 278.00 | $188.00 | 0.95% | 0.32% | $0.34 | $104.80 |
| 2024 | Painting & Surface Coatings | Google Search | $432,973.50 | 85,997.00 | 1,094,583.00 | 4,859.39 | $150,789.30 | 7.86% | 5.65% | $5.03 | $89.10 |
| 2024 | Painting & Surface Coatings | Google TV | $0.00 | 0.00 | 0.00 | 0.00 | $0.00 | ||||
| 2024 | Painting & Surface Coatings | Google owned channels | $0.00 | 0.00 | 0.00 | 0.00 | $0.00 | ||||
| 2024 | Painting & Surface Coatings | Maps | $0.00 | 0.00 | 0.00 | 0.00 | $0.00 | ||||
| 2024 | Painting & Surface Coatings | Search partners | $130,757.60 | 58,844.00 | 639,651.00 | 2,898.00 | $3,378.00 | 9.20% | 4.92% | $2.22 | $45.12 |
| 2024 | Painting & Surface Coatings | YouTube | $0.00 | 0.00 | 0.00 | 0.00 | $0.00 | ||||
| 2025 | Painting & Surface Coatings | Cross-network | $713,433.70 | 188,736.00 | 17,558,595.00 | 7,742.73 | $116,724.74 | 1.07% | 4.10% | $3.78 | $92.14 |
| 2025 | Painting & Surface Coatings | Discover | $359.22 | 115.00 | 10,633.00 | 0.00 | $0.00 | 1.08% | 0.00% | $3.12 | inf |
| 2025 | Painting & Surface Coatings | Gmail | $557.00 | 3,974.00 | 37,226.00 | 0.00 | $0.00 | 10.68% | 0.00% | $0.14 | inf |
| 2025 | Painting & Surface Coatings | Google Display Network | $5,223.75 | 13,973.00 | 1,711,963.00 | 21.00 | $28.93 | 0.82% | 0.15% | $0.37 | $248.75 |
| 2025 | Painting & Surface Coatings | Google Search | $683,790.00 | 81,848.00 | 1,090,391.00 | 6,290.17 | $91,654.15 | 7.51% | 7.69% | $8.35 | $108.71 |
| 2025 | Painting & Surface Coatings | Google TV | $0.00 | 0.00 | 0.00 | 0.00 | $0.00 | ||||
| 2025 | Painting & Surface Coatings | Google owned channels | $0.00 | 0.00 | 0.00 | 0.00 | $0.00 | ||||
| 2025 | Painting & Surface Coatings | Maps | $0.00 | 0.00 | 0.00 | 0.00 | $0.00 | ||||
| 2025 | Painting & Surface Coatings | Search partners | $53,815.00 | 19,085.00 | 97,195.00 | 223.00 | $2,479.00 | 19.64% | 1.17% | $2.82 | $241.32 |
| 2025 | Painting & Surface Coatings | YouTube | $8,848.99 | 12,515.00 | 964,156.00 | 6.00 | $501.00 | 1.30% | 0.05% | $0.71 | $1,474.83 |
Painting campaigns remain highly efficient and Search-driven, with additional networks playing a supporting role in expanding reach and reinforcing brand visibility.
Painting has become more competitive in Google Ads.
This means efficiency matters more than ever.
Unlike other industries, painting tends to maintain:
Which makes it a highly optimizable industry
We consistently see:
Two accounts spending the same can have wildly different results.
Painting searches tend to be:
Which means:
Across painting campaigns, these are the most frequent problems:
If you’re running Google Ads:
You should expect:
You should focus on:
You should avoid:
These numbers give you a realistic performance range, not a guarantee.
Your results will vary based on:
If your current results are:
There’s usually a fixable reason.
We work with businesses across industries to improve performance and efficiency in Google Ads.
We’ll show you: